What a transaction?
A transaction is one logical piece of work in the database, or 'the execution of a program that includes database access operations'. Some transactions are read-only transactions while other transactions update, or write, to the database. All transactions must exhibit the ACID properties. Transactions that make changes to the database are completed when they are committed or rolled back.
SQL> select count(*) from emp;
Count(*)
--------
14
Here Since no data was modified in this transaction, a commit or rollback was unnecessary. It can be considered as read-only transaction.
The following query updates data in the database:
SQL> delete from emp where empno=7934;
1 row deleted.
SQL> commit;
Commit complete.
In the above example, we made a change to the database and committed that change. On successful commit, the transaction is complete and a new one begins.
In some cases, one transaction can consist of multiple SQL statements.
SQL> update emp set ename='JOHNSON' where empno=7876;
1 row updated.
SQL> update emp set ename='JACKSON' where empno=7902;
1 row updated.
ORA9I SQL> rollback;
Rollback complete.
In this example, we issued different SQL statements before rolling back the transaction. All the SQL statements in this example comprised one transaction. The transaction ended with the ROLLBACK statement. These are not separate transactions.
COUNTING TRANSACTIONS
Oracle keeps track of this as a statistic which gets reset when the instance is brought down. So if you want to keep track of your transactions, you’ll have to capture this information before the database is brought down.
The V$SYSSTAT and V$SESSTAT are dynamic performance views where the statistics are stored.
The V$SYSSTAT view gives us 'database-wide' statistics. The V$SESSTAT gives us statistics for each current session. As soon as the current session ends, the statistics are removed from this view. Also, V$SESSTAT does not show the statistic name. You’ll have to join this view with V$STATNAME on the STATISTIC# column to get the statistic name. V$SYSSTAT does have the statistic name.
COUNTING COMMITS AND ROLLBACKS
Oracle has made it very easy for us to count the number of commits in the database.
SQL> select name,value from v$sysstat where name='user commits';
NAME VALUE
-------------------- ----------
user commits 26
SQL> update emp set sal=sal*1.03 where empno=7369;
1 row updated.
SQL> commit;
Commit complete.
SQL> select name,value from v$sysstat where name='user commits';
NAME VALUE
-------------------- ----------
user commits 27
we looked for the ’user commits’ statistic before and after our UPDATE statement. As can be expected, this statistic was increased by one after we committed our work.
Similarly, there is a statistic for measuring rollbacks.
SQL> select name,value from v$sysstat where name='user rollbacks';
NAME VALUE
-------------------- ----------
user rollbacks 12
SQL> update emp set sal=sal*1.05 where empno=7902;
1 row updated.
SQL> rollback;
Rollback complete.
SQL> select name,value from v$sysstat where name='user rollbacks';
NAME VALUE
-------------------- ----------
user rollbacks 13
The ’user rollbacks’ statistic shows how many rollbacks have been issued.
SQL> select name,value from v$sysstat
2 where name in ('user rollbacks','user commits');
NAME VALUE
-------------------- ----------
user commits 27
user rollbacks 13
SQL> select count(*) from emp;
Count(*)
--------
13
SQL> select name,value from v$sysstat
2 where name in ('user rollbacks','user commits');
NAME VALUE
-------------------- ----------
user commits 27
user rollbacks 13
COUNTING SELECTS
So how do we count SELECT statements? There is another statistic, 'user calls', which is as close as we are going to get.
SQL> select name,value from v$sysstat where name='user calls';
NAME VALUE
-------------------- ----------
user calls 49635
SQL> select count(*) from emp;
Count(*)
--------
13
ORA9I SQL> select name,value from v$sysstat where name='user calls';
NAME VALUE
-------------------- ----------
user calls 49641
Average number of commits and rollbacks per day
SQL> select value/up_days as tx_per_day
from (select sum(value) as value from v$sysstat
where name in ('user commits','user rollbacks')),
(select sysdate-startup_time as up_days from v$instance);
TX_PER_DAY
----------
1527355.99
If you database does not have a high number of DML statements, then the above query will not give you a true indicator of how busy the system is.
SQL> select value/up_days as calls_per_day
from (select value from v$sysstat where name='user calls'),
(select sysdate-startup_time as up_days from v$instance);
CALLS_PER_DAY
-------------
15614059.8
Note: This Document/blog is only and only meant to guide/help the newbies.
Sep 28, 2006
Sep 20, 2006
Excessive wait events
SQL> select a.event e0, count(*) t0 from sys.v_$session_wait a , sys.v_$event_name n where a.event= n.name group by event;
E0 T0
---------------------------------------------------------------- ----------
SQL*Net message from client 135
SQL*Net message to client 1
db file scattered read 5
db file sequential read 6
enqueue 144
latch free 1
pipe get 1
pmon timer 1
rdbms ipc message 12
smon timer 1
10 rows selected.
Here equeue represents that some session is holding the lock.
To find out which session is holding the lock:
SQL> select /*+ RULE */ a.session_id, s.serial#, s.username, s.status
from dba_locks a, v$session s
where a.blocking_others = 'Blocking'
and a.session_id = s.sid
order by 1;
SESSION_ID SERIAL# USERNAME STATUS
---------- ---------- ------------------------------ --------
436 5032 TEST INACTIVE
SQL> select sql_address, username, SQL_HASH_VALUE,LOGON_TIME,LAST_CALL_ET,status from v$session where sid=436;
SQL_ADDR USERNAME SQL_HASH_VALUE LOGON_TIME LAST_CALL_ET STATUS
-------- ------------------------------ -------------- ------------------- ------------ --------
00 TEST 0 2006-09-20 00:04:39 0 INACTIVE
SQL> select a.sql_text from v$session b,v$sqlarea a where a.address=b.sql_address and b.sid=436;
no rows selected
If SQL_ADDRESS shows some what like '00' it means that particular session not doing any transaction.
To release the Block/LOCK Kill the session based on the sql it is holding/ by knowing the imp. of the sql.
alter system kill session '436,5032';
Sep 6, 2006
How The Oracle Database Processes SQL Statements
The following is a summary of how Oracle processes SQL statements. First the flowchart followed by a brief explanation of each step.
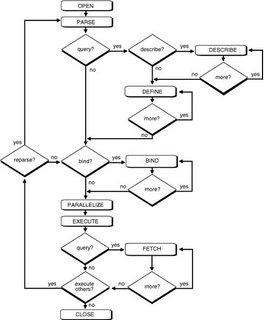
Step 1: Create a Cursor
Cursor creation can either occur implicitly or be explicitly declared.
Step 2: Parse the Statement
What is parsing? Parsing is the process of:
·Translating a SQL statement, verifying it to be a valid statement
·Performing data dictionary lookups to check table and column definitions
·Acquiring parse locks on required objects so that their definitions do not change during the statement’s parsing
·Checking privileges to access referenced schema objects
·Determining the optimal execution plan for the statement
·Loading it into a shared SQL area
·Routing all or part of distributed statements to remote nodes that contain referenced data
If a similar SQL statement exists in the shared pool, Oracle skips the parsing step. A SQL statement is parsed once no matter how many times the statement is run. As you can see, parsing does many things and consumes time and resources. You should always aim at minimizing parsing when writing SQL.
Step 3: Describe Results of a Query
This step is performed in the case of a query (SELECT) processing. The describe step determines the characteristics (datatypes, lengths, and names) of a query’s result.
Step 4: Define Output of a Query
This step is performed in the case of a query (SELECT) processing. In this step, you specify the location, size, and datatype of variables defined to receive each fetched value. These variables are called define variables. Oracle performs datatype conversion if necessary.
Step 5: Bind Any Variables
At this point, Oracle knows the meaning of the SQL statement but still does not have enough information to run the statement. Oracle needs values for any variables listed in the statement. The process of obtaining these values is called binding variables.
Step 6: Parallelize the Statement
Oracle can parallelize DML and some DDL in this step.
Step 7: Run the Statement
At this point, Oracle has all necessary information and resources, so the statement is run. If it is an UPDATE or DELETE statement, however, all rows that the statement affects are locked from use by other users of the database until the next COMMIT, ROLLBACK, or SAVEPOINT for the transaction.
Step 8: Fetch Rows of a Query
This step is performed in the case of a query (SELECT) processing. The rows are selected and ordered (if requested by the query), and each successive fetch retrieves another row of the result until the last row has been fetched.
Step 9: Close the Cursor
The last step of processing a SQL statement is to close the cursor.
Note: This Documentation is been copied from the site/blog, Only and only for helping the Newbies in DBA. (With Courtesy)
Sep 5, 2006
ROLLBACK CONTENTION STATISTICS
To properly configure a system's rollback segments, you must create enough rollback segments, and they must be of a sufficient size. That seems fairly simple, but it is not. You can observe how the rollback segments are being used, and from that determine what needs to be done.
Determining the Number of Rollback Segments
The number of rollback segments should be determined by the number of concurrent transactions in the database. Remember--the fewer transactions per rollback segment, the less contention. A good rule of thumb is to create about one rollback segment for every four concurrent transactions.
Rollback contention occurs when too many transactions try to use the same rollback segment at the same time, and some of them have to wait. You can tell whether you are seeing contention on rollback segments by looking at the dynamic performance table, V$WAITSTAT. Following is the data contained by V$WAITSTAT that is related to rollback segments:
* UNDO HEADER--The number of waits for buffers containing rollback header blocks.
* UNDO BLOCK--The number of waits for buffers containing rollback blocks other than header blocks.
* SYSTEM UNDO HEADER--Same as UNDO HEADER for the SYSTEM rollback segment.
* SYSTEM UNDO BLOCK--Same as UNDO BLOCK for the SYSTEM rollback segment.
The system rollback segment is the original rollback segment that was created when the database was created. This rollback segment is used primarily for special system functions but is sometimes used when no other rollback segment is available. Typically the SYSTEM rollback segment is not used, and you do not need to be concerned about it.
SQL> col name format a15
SQL> col wraps format 99999
SQL> col shrinks format 99999
SQL> col extends format 99999
SQL> set pages 40
SQL> select name, gets, round(waits/gets*100,3) "Pct Waits",writes, wraps, shrinks, extends
from v$rollstat, v$rollname
where v$rollstat.usn = v$rollname.usn
and v$rollname.name != 'SYSTEM';
NAME GETS Pct Waits WRITES WRAPS SHRINKS EXTENDS
--------------- ---------- ---------- ---------- ------ ------- -------
_SYSSMU1$ 2119454 .002 349971066 524 61 177
_SYSSMU2$ 2159979 .003 366184380 560 70 175
_SYSSMU3$ 2166968 .002 372017462 523 58 173
_SYSSMU4$ 2625707 .003 425201464 627 66 211
_SYSSMU5$ 2511741 .002 437697190 635 69 228
_SYSSMU6$ 2064043 .002 344161682 494 53 159
_SYSSMU7$ 2115427 .003 426560784 621 70 245
_SYSSMU8$ 2539862 .003 381893486 548 57 174
_SYSSMU9$ 2559839 .002 419910174 627 71 222
_SYSSMU10$ 2679432 .002 466469086 643 74 240
_SYSSMU11$ 1285735 .002 201921514 3 0 1
_SYSSMU12$ 1367639 .003 255898414 2 0 0
12 rows selected.
SQL> set head off
SQL> select 'The average of waits/gets is '||
round((sum(waits) / sum(gets)) * 100,2)||'%'
from v$rollstat;
The average of waits/gets is 0%
If the ratio of waits to gets is more than 1% or 2%, consider creating more rollback segments.
Another way to gauge rollback contention is:
SQL> set head on
SQL> select class, count
from v$waitstat
where class in ('system undo header', 'system undo block', 'undo header', 'undo block' );
CLASS COUNT
------------------ ----------
system undo header 2
system undo block 0
undo header 1333
undo block 24
SQL> set head off
SQL> select 'Total requests = '||sum(count) xn1, sum(count) xv1
from v$waitstat 2 ;
Total requests = 117316
column xn1 format 9999999
column xv1 new_value xxv1 noprint
SQL> select 'Contention for system undo header = '||
(round(count/(&xxv1+0.00000000001),4)) * 100||'%'
from v$waitstat
where class = 'system undo header' 2 3 4
5 /
old 2: (round(count/(&xxv1+0.00000000001),4)) * 100||'%'
new 2: (round(count/( 117318+0.00000000001),4)) * 100||'%'
'CONTENTION FOR SYSTEM UNDO HEADER = '
--------------------------------------------------------------------------------
Contention for system undo header = 0%
SQL> select 'Contention for system undo block = '||
(round(count/(&xxv1+0.00000000001),4)) * 100||'%'
from v$waitstat
where class = 'system undo block' 2 3 4
5 /
old 2: (round(count/(&xxv1+0.00000000001),4)) * 100||'%'
new 2: (round(count/( 117318+0.00000000001),4)) * 100||'%'
'CONTENTION FOR SYSTEM UNDO BLOCK
--------------------------------------------------------------------------------
Contention for system undo block = 0%
SQL> select 'Contention for undo header = '||
(round(count/(&xxv1+0.00000000001),4)) * 100||'%'
from v$waitstat
where class = 'undo header' 2 3 4 ;
old 2: (round(count/(&xxv1+0.00000000001),4)) * 100||'%'
new 2: (round(count/( 117318+0.00000000001),4)) * 100||'%'
'CONTENTION FOR UNDO HEADER =
--------------------------------------------------------------------------------
Contention for undo header = 1.14%
SQL> select 'Contention for undo block = '||
(round(count/(&xxv1+0.00000000001),4)) * 100||'%'
from v$waitstat
where class = 'undo block' 2 3 4 ;
old 2: (round(count/(&xxv1+0.00000000001),4)) * 100||'%'
new 2: (round(count/( 117318+0.00000000001),4)) * 100||'%'
'CONTENTION FOR UNDO BLOCK='
--------------------------------------------------------------------------------
Contention for undo block = 1.97%
SQL>
If the percentage for an area is more than 1% or 2%, consider creating more rollback segments.
We do have some "undo block" contention since the percent wait is 1.97%. We cannot manually add more rollback segments since ours is System Managed Undo.
Another way to gauge rollback contention is:
Hit Ratio should be >= 99% - if not, consider adding additional rollback segments.
SQL> select b.NAME,
a.USN seg#,
GETS,
WAITS,
round(((GETS-WAITS)*100)/GETS,2) hit_ratio,
XACTS active_transactions,
WRITES
from v$rollstat a,
v$rollname b
where a.USN = b.USN;
Note: Scripts published in this blog are tested, but under any circumstance of failures or bad effect/low performance on database point of view, members of this blog are no were responsible.
Subscribe to:
Posts (Atom)